Reading Line Plots Worksheets for 2nd Grade
Download PDF worksheetAnswer key (PDF)Worksheet + answer key (2 pages)
Prints on one US Letter page; the answer key is a separate page. Print at 100% / "Actual size" on US Letter paper. Free for personal and classroom use. Version 1 of 10. Choose another version.
Skill: Reading line plots of measured lengths in whole inches and answering questions about the data
Teaching tips and what to try next
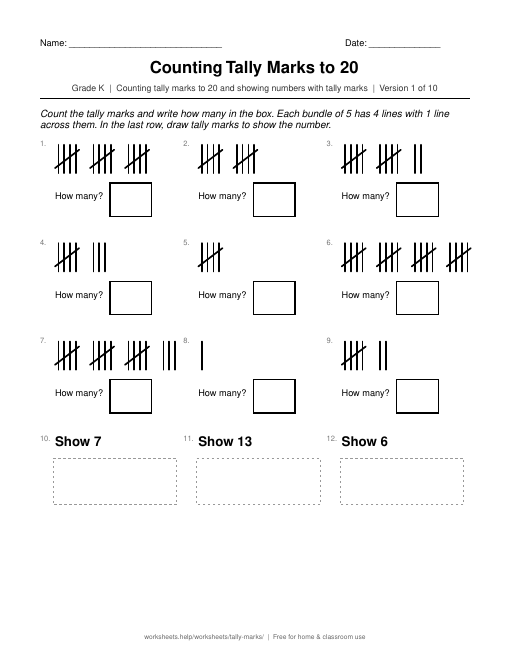
Works for second graders who can count objects and have measured lengths in whole inches with Measuring Length in Inches With a Ruler. Children sometimes add the lengths instead of counting the Xs for the total, so have them say "each X is one thing" before they start. Other ways to show data are in Reading Bar Graphs and Counting Tally Marks to 20.
10 versions, each with its own answer key
Same skill and layout, a fresh set of problems in every version, so children can keep practicing without repeating a page. Problems are not repeated between versions unless a skill has only a small number of possible problems (for example, the addition facts within 10).
- Version 1: Sheet · Key · Both
- Version 2: Sheet · Key · Both
- Version 3: Sheet · Key · Both
- Version 4: Sheet · Key · Both
- Version 5: Sheet · Key · Both
- Version 6: Sheet · Key · Both
- Version 7: Sheet · Key · Both
- Version 8: Sheet · Key · Both
- Version 9: Sheet · Key · Both
- Version 10: Sheet · Key · Both
Download all 10 versions (one PDF)All 10 answer keys (PDF)
Make a new one
Want more practice? Make a brand-new Reading Line Plots sheet with fresh problems and its matching answer key, created right in your browser.
Related worksheets
About this worksheet
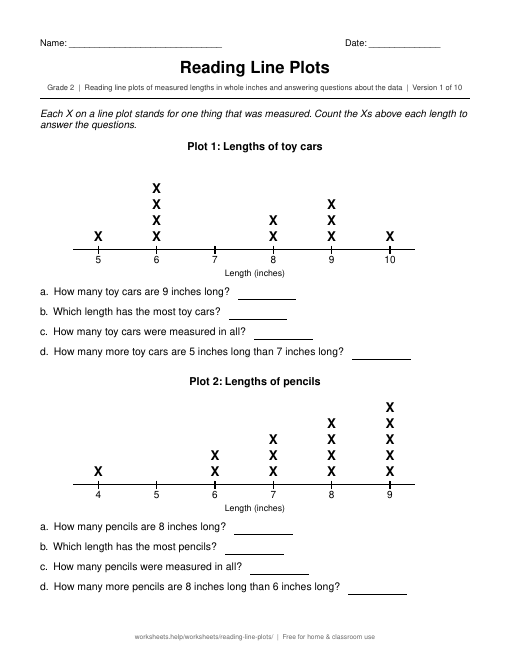
A line plot is a simple way to show a set of measurements. Each X sits above a number line at the length that was measured, so tall stacks show the most common lengths. Second graders are expected to show measurement data on a line plot marked in whole units, and reading line plots is the first step. This second grade worksheet practices reading them.
The page has two line plots. Each one shows the lengths of a group of everyday things, such as pencils, leaves, ribbons, shells or toy cars, measured to the nearest inch. Under each plot are four questions. Children find how many things have a certain length, which length has the most, how many things were measured in all, and how many more have one length than another. Every plot has a single tallest stack, so the most common length is clear. Each of the ten versions has new data and its own answer key.
How to use it: start by reading the number line together and asking what one X stands for. Have your child put a finger on each stack and count the Xs out loud. For the total, suggest writing the count under each stack first and then adding. For the "how many more" question, remind your child to subtract the smaller count from the bigger one. Making a real line plot of measured crayons is a great follow-up.
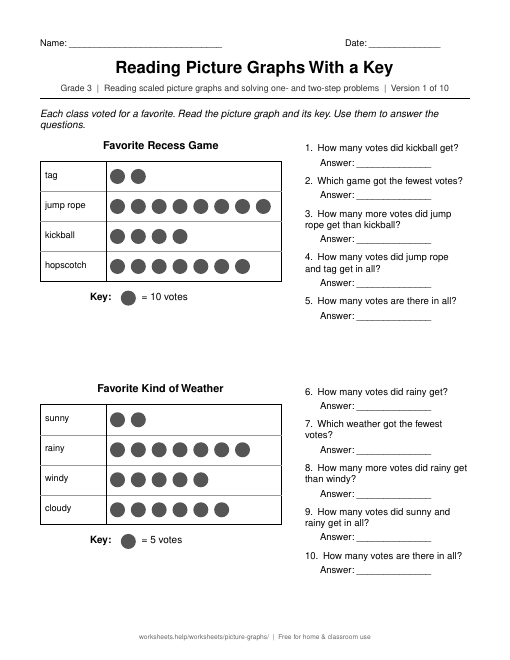
The answer key shows the answer to every question. For other kinds of graphs, try our Reading Bar Graphs worksheet and our Reading Picture Graphs With a Key worksheet.