Reading Bar Graphs Worksheets for 2nd Grade
Download PDF worksheetAnswer key (PDF)Worksheet + answer key (2 pages)
Prints on one US Letter page; the answer key is a separate page. Print at 100% / "Actual size" on US Letter paper. Free for personal and classroom use. Version 1 of 10. Choose another version.
Skill: Reading bar graphs and solving put-together, take-apart, and compare problems
Teaching tips and what to try next
Reading a bar graph means lining up the top of each bar with the scale, which is easier with a ruler or a strip of paper laid across. Encourage "how many more" questions, since comparing is the core of 2nd-grade data work. For more story problems, try Addition and Subtraction Word Problems Within 100.
10 versions, each with its own answer key
Same skill and layout, a fresh set of problems in every version, so children can keep practicing without repeating a page. Problems are not repeated between versions unless a skill has only a small number of possible problems (for example, the addition facts within 10).
- Version 1: Sheet · Key · Both
- Version 2: Sheet · Key · Both
- Version 3: Sheet · Key · Both
- Version 4: Sheet · Key · Both
- Version 5: Sheet · Key · Both
- Version 6: Sheet · Key · Both
- Version 7: Sheet · Key · Both
- Version 8: Sheet · Key · Both
- Version 9: Sheet · Key · Both
- Version 10: Sheet · Key · Both
Download all 10 versions (one PDF)All 10 answer keys (PDF)
Make a new one
Want more practice? Make a brand-new Reading Bar Graphs sheet with fresh problems and its matching answer key, created right in your browser.
Related worksheets
About this worksheet
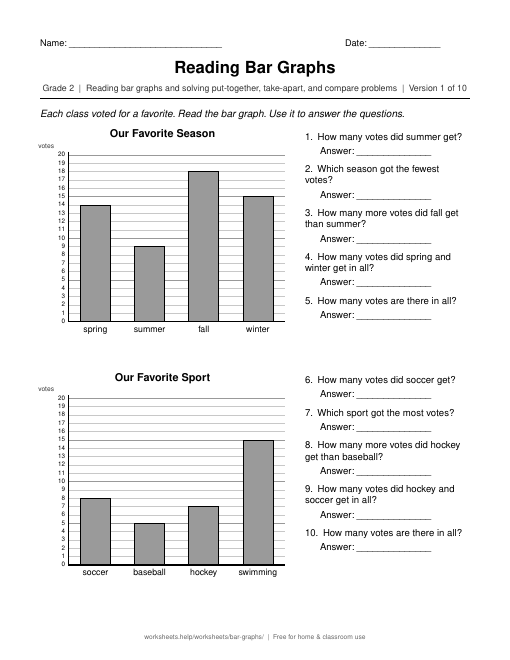
Bar graphs are one of the first data displays children learn to read, and they show up in science, social studies, and the news. This second-grade worksheet has two bar graphs, each showing how a class voted for a favorite, such as fruit, season, or zoo animal. The scale goes from 0 to 20 by ones, so every bar can be read exactly.
Each graph comes with five questions. Students read one bar ("How many votes did bananas get?"), find the category with the most or fewest votes, compare two bars ("How many more votes did winter get than fall?"), add two bars together, and find the total number of votes. These are exactly the put-together, take-apart, and compare questions that second graders are expected to answer from a graph. The ten versions use new topics and new numbers each time.
How to use it: before answering, look at the graph together. Read the title, the labels under each bar, and the numbers on the side. Show your child how to slide a finger from the top of a bar straight across to the number scale. For compare questions, remind them to subtract the smaller number from the bigger one. To extend the activity, take a quick family vote on a favorite food and draw your own bar graph on graph paper.
The answer key lists the answer to every question. This worksheet supports Common Core standard 2.MD.D.10 (draw a picture graph and a bar graph to represent a data set with up to four categories, and solve simple problems using information in a bar graph). Practice the math with our Addition and Subtraction Word Problems Within 100 worksheet.